

A sales pipeline template looks easy to build: a list of deals, a stage column, a value. Most of the ones people download still end up abandoned after about six weeks. To find out why, and what a pipeline sheet has to do to last, we put the questions to someone who runs one every week.
A note on the interview: Marisol Ortega is a composite. Her answers draw on common sales-operations practice, and Cobalt Ridge Software, its reps, deals and figures are illustrative. The two templates she talks about are real and free to download below: an Excel sales pipeline tracker and a Word weekly pipeline review.
On why pipeline spreadsheets die
Most teams start with a pipeline spreadsheet. Why do so many stop using it?
Because it becomes a list of hopes. Reps add deals and never take them off. Six weeks later the sheet shows $2 million of pipeline, the team closes $150,000, and nobody trusts it again. The sheet didn’t fail. Nothing in it ever pushed back. A pipeline has to tell you when a deal is stuck, when a date has passed, when nobody’s doing anything about it. If it can’t, it’s just a list.
So what does pushing back look like in a spreadsheet?
One column: Flag. Ours checks four things in order. Has the close date passed? Is there a next step with a date? Is that date in the past? Has the deal sat in its stage longer than the limit for that stage? Any one of those puts text in the cell and turns the row pink. This week, five of our nine open deals are flagged. That sounds bad, but it’s actually the point. Those five are what we talk about on Friday.
On stages and exit criteria
How many stages should a pipeline have?
Five open stages, plus won and lost. Ours are Qualify, Discovery, Proposal, Negotiation and Verbal. More than that and reps argue about which stage a deal is in, which wastes everyone’s time. The names matter less than the exit criteria: what has to be true before a deal moves on. Discovery isn’t finished when you’ve had a nice call. It’s finished when the pain is quantified and you know how the buyer makes decisions and when. Those definitions live on the Stages tab, so nobody can claim they didn’t know.
| Stage | Probability | Stale after | Exit criteria |
|---|---|---|---|
| 1 Qualify | 10% | 14 days | Budget owner identified; problem confirmed on a call |
| 2 Discovery | 20% | 21 days | Pain quantified; decision process and date known |
| 3 Proposal | 40% | 21 days | Proposal sent and walked through with the buyer |
| 4 Negotiation | 70% | 14 days | Terms under discussion; legal or procurement engaged |
| 5 Verbal | 90% | 10 days | Verbal yes; paperwork in signature |
Where do those probabilities come from?
At first, they’re a sensible guess. After two or three quarters, they come from your own history: of all the deals that reached Proposal, what share closed? Ours are close to the industry rules of thumb you’ll see quoted, but I’d rather trust our own numbers than a blog post’s. You change them in one place, on the Stages tab, and every row on the pipeline looks the new values up with INDEX/MATCH.
On the weighted forecast
Explain weighted pipeline for someone who’s never used it.
Each deal’s value multiplied by its stage probability. Harborview Clinics is $86,400 in Negotiation at 70%, so it counts as $60,480. Add up the open deals and you get the weighted forecast. Ours is $132,720 on $296,400 of open pipeline. It’s not a prediction for any single deal. Harborview will close at $86,400 or zero, never at $60,480. Across a dozen deals, though, the errors roughly cancel out. That’s why it works for a team and is close to useless for one rep with three deals.
And commit?
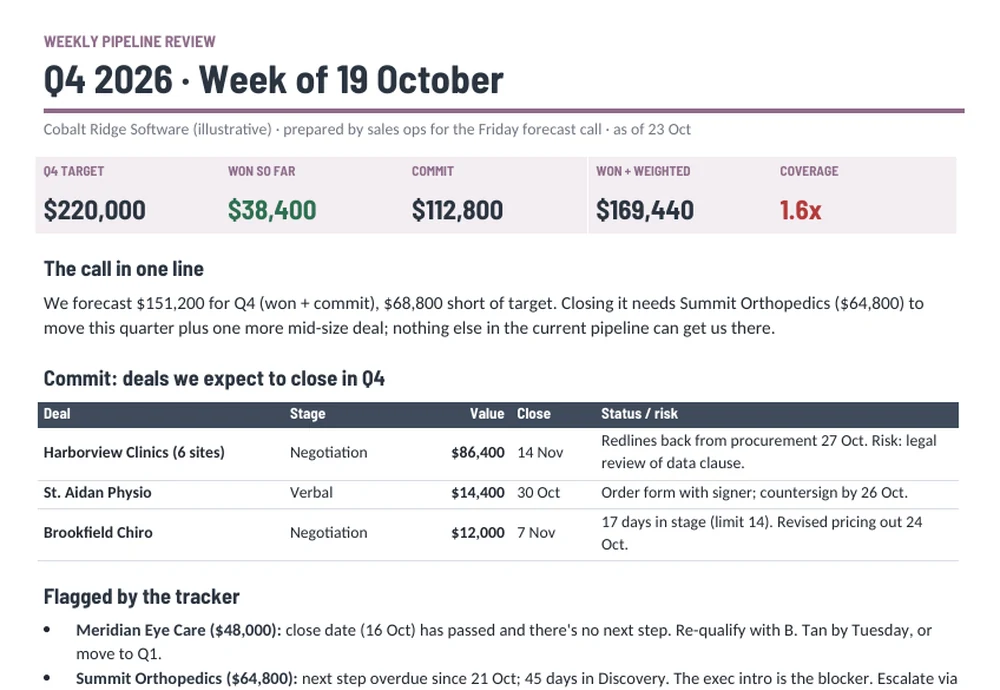
Commit is the number I’d stake my reputation on: deals at 70% or above that are due to close this quarter. For Q4 that’s $112,800: Harborview, St. Aidan Physio and Brookfield Chiro. The Forecast tab breaks won, commit and weighted down by close month, so I can see that November is carrying most of the quarter and December looks thin.
On coverage, the number she checks first
What’s the first number you look at on a Friday?
Coverage. That’s open pipeline divided by what we still need to reach target. Our Q4 target is $220,000 and we’ve won $38,400, so we still need $181,600. Open pipeline is $296,400, which gives coverage of 1.6x. Most B2B teams want around 3x at the start of a quarter, because a lot of open pipeline won’t close. At 1.6x you’re relying on everything going right. So the tracker shows it in red, and my Friday note says plainly that we’re $68,800 short on won plus commit and that only Summit Orthopedics can close most of that gap.
Isn’t that a depressing thing to send your VP?
It would be worse in December. A pipeline review is useful because it tells you early enough to do something. Eight weeks out, we can still push Summit, find another mid-size deal, or bring Q1 deals forward. Two weeks out, all we could do is explain why we missed.
On stale deals
Walk us through one flagged deal.
Meridian Eye Care: $48,000, in Proposal. The close date was 16 October, a week ago, and there’s no next step. The tracker shows Close date passed. Either B. Tan has a real next step and a new date by Tuesday, or the deal moves to Q1, or it’s lost. The one thing it can’t do is stay as it is. Deals like that inflate the pipeline and the coverage ratio and make the forecast look healthier than it is.
Summit Orthopedics is the opposite problem. It’s a real deal with a real champion, but it’s been in Discovery for 45 days and the next step was due on the 21st. That doesn’t need cleaning up. It needs escalating: an email from our CEO to their COO.
Some teams delete stale deals. You flag them. Why?
If you delete them, you lose what happened. Marking them Lost with a reason (“lost to incumbent on price”, “no decision, budget frozen”) is what makes the win rate mean something. Ours is 60% of closed deals, three won and two lost. If you quietly delete the losses, you’ll report 100% and learn nothing from them.
On the weekly review document
Why a Word review as well as the spreadsheet?
The spreadsheet is the data. The review is what we decided about it, and it takes me 20 minutes. A strip of five numbers: target, won, commit, won plus weighted, coverage. One sentence on the forecast. A table of commit deals with their risks. The flagged deals with an action for each. What changed since last week. Then the asks. This week there are two: a CEO email to Summit, and approval for a 5% multi-site discount ceiling so Harborview’s procurement isn’t waiting on us.
The asks are the most important part. If a pipeline review doesn’t ask for anything, it’s only a status update.
Weighted pipeline and coverage, quickly
Before you load every deal into the tracker, list the big ones here. The stage probabilities match the Stages table above, and you can change any of them.
Weighted value = Σ deal value × stage probability. Coverage = open pipeline ÷ (target − won). The 3× figure is a common B2B rule of thumb, not a law; your own close rates are the better guide.
The Excel sales pipeline tracker
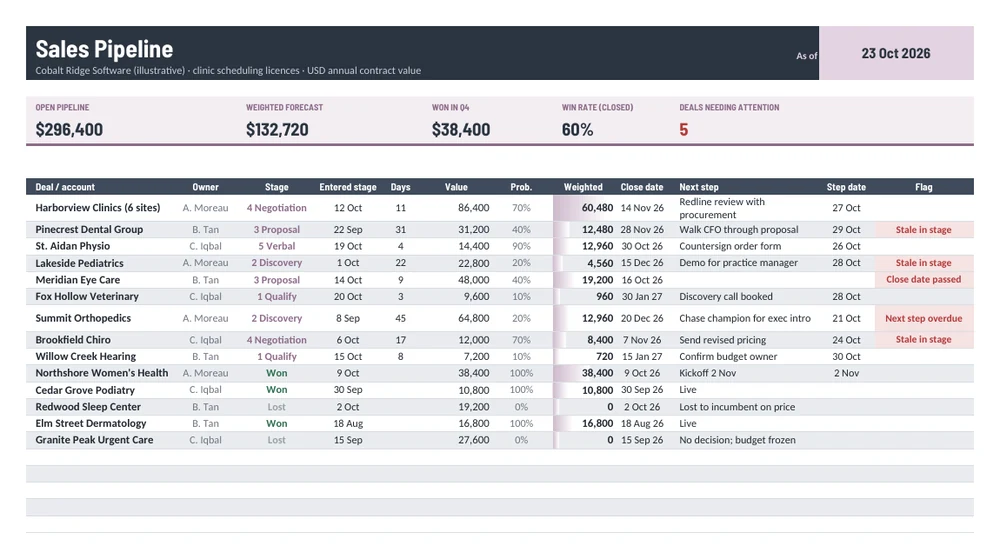
The tracker has three tabs. Pipeline has 50 rows, with the stage and owner picked from dropdowns. Days in stage, probability, weighted value and the flag are all calculated, and a data bar shows where the weighted value sits. Forecast totals the open pipeline by stage (count, value, weighted value and average days in stage) and breaks the quarter down by close month into won, commit and weighted. It also shows target, gap and coverage. Stages holds the probabilities, the stale limits and the exit criteria. Change the As of date at the top, or replace it with =TODAY().
The Word weekly pipeline review
Where the pipeline sits among your other sales reports
The pipeline looks ahead. The sales report looks back at what actually closed, and sales revenue reporting follows the money once it’s booked. If your team tracks activity (calls, demos, proposals sent), add those counts to a weekly report. Coverage and win rate are also worth tracking as part of a broader KPI report.
Marisol Ortega is a composite interviewee. Cobalt Ridge Software, its staff, prospects and figures are illustrative.