

An inventory report template gives you a ready-made format to record what stock you have, what came in, what went out and what it is all worth. Instead of building a spreadsheet from scratch every month, you can download an editable inventory report format, add your item list and let the formulas calculate closing stock, stock value and reorder alerts for you.
On this page you will find two free, fully editable templates: a Stock Inventory Report in Excel with automatic calculations and a Physical Inventory Count Report in Word for year-end and cycle counts. Both are designed for small businesses, retail shops, warehouses, restaurants, offices, schools and anyone who needs a clear, printable record of stock on hand.
What Is an Inventory Report?
An inventory report is a document that summarises the quantity, movement and value of goods held by a business over a specific period. It usually lists each item by code or SKU, shows the opening balance, stock received, stock issued or sold, the closing balance and the value of the remaining stock. Many inventory reports also flag items that have fallen below a reorder level so that purchasing can act before a stock-out happens.
Because stock is often one of the largest assets on a balance sheet, the inventory report also feeds directly into your accounts. The closing stock value is used to calculate cost of goods sold, gross profit and the figures that appear in your financial reports and annual reports.
Why Use an Inventory Report Template?
Keeping stock records in a consistent format saves time and prevents expensive mistakes. A good stock report template helps you to:
- Avoid stock-outs and overstocking by comparing closing stock against reorder levels.
- Know the value of your inventory at any time for accounting, insurance and tax purposes.
- Spot shrinkage, theft or damage by comparing system quantities with physical counts.
- Improve purchasing decisions using clear data on fast-moving and slow-moving items.
- Save time with built-in formulas instead of manual calculations.
- Share consistent reports with owners, managers, auditors and suppliers.
Types of Inventory Reports
Different businesses need different stock reports. The most common types are:
- Stock on hand report – a snapshot of current quantities by item and location.
- Inventory movement report – opening stock, receipts, issues and closing stock for a period.
- Inventory valuation report – quantity multiplied by unit cost to show total stock value.
- Reorder or low-stock report – items at or below their minimum level.
- Physical inventory count report – counted quantities compared with system records, with variances explained.
- Ageing or slow-moving stock report – items that have not sold for a set number of days.
The two templates below cover the first five types, and you can easily add an extra column for last movement date if you also want to track slow-moving stock.
Free Inventory Report Templates (Editable)
1. Stock Inventory Report Template (Excel)
This inventory report template in Excel is built for regular monthly or weekly stock reporting. Enter the item code, description, category, unit, opening stock, stock received and stock issued, and the sheet automatically calculates the closing stock and stock value. A status column compares closing stock with the reorder level and shows In Stock, Reorder or Out of Stock with green, amber and red colour coding.
At the bottom you get a summary with the total number of SKUs, total inventory value, number of items to reorder and items out of stock, plus space for notes and sign-off. Blank formula rows are already included so you can keep adding products.
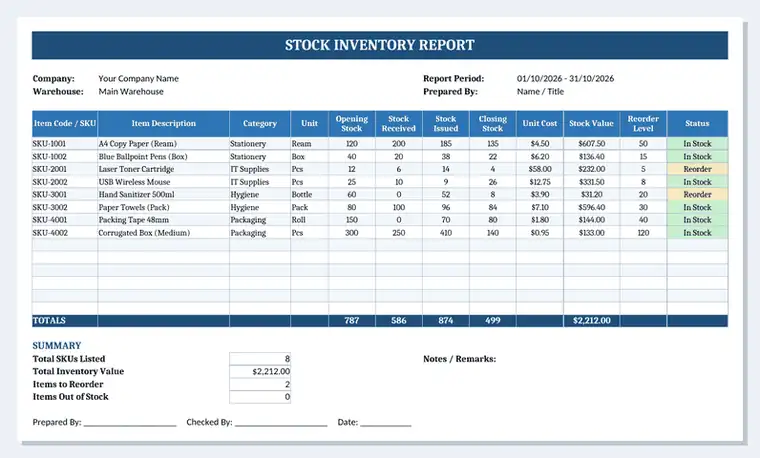
Best for: retail shops, small warehouses, online sellers, offices and stores that need a monthly stock report with automatic totals.
2. Physical Inventory Count Report Template (Word)
This physical inventory count report is designed for year-end stocktakes and cycle counts. It is laid out as a printable count sheet so counters can record the system quantity, counted quantity, variance, unit cost, variance value and the reason for each difference directly on paper or on screen.
It also includes a count summary (items counted, items with variance, system value, counted value, net variance and accuracy rate), a findings and corrective actions table, and a sign-off section for the counter, checker, warehouse manager and finance or audit representative. This makes it a useful supporting document for an audit report.
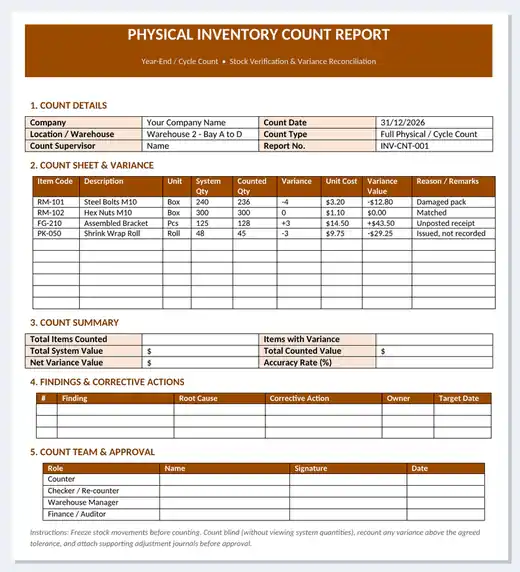
Best for: year-end stocktakes, cycle counts, audit preparation and reconciling physical stock with accounting records.
What to Include in an Inventory Report
Whichever format you use, a complete inventory report should contain the following information:
| Section | What to record | Why it matters |
|---|---|---|
| Report header | Company name, warehouse or location, report period, prepared by | Makes the report traceable and easy to file |
| Item details | Item code or SKU, description, category, unit of measure | Identifies each product without confusion |
| Stock movement | Opening stock, stock received, stock issued or sold | Shows how stock changed during the period |
| Closing stock | Opening + received − issued | The quantity you should have on hand |
| Valuation | Unit cost and total stock value | Needed for accounts, insurance and tax |
| Reorder control | Reorder level and stock status | Prevents stock-outs and lost sales |
| Summary and notes | Totals, items to reorder, remarks, signatures | Gives managers a quick overview and accountability |
How to Create an Inventory Report (Step by Step)
- Choose the reporting period. Decide whether you report weekly, monthly or quarterly and keep it consistent.
- List every item. Add an item code or SKU, description, category and unit for each product you stock.
- Enter opening stock. Use the closing stock from your previous report so the figures carry forward correctly.
- Record receipts and issues. Take quantities from purchase orders, goods received notes, sales and issue slips.
- Calculate closing stock and value. The Excel template does this automatically: closing stock = opening + received − issued, and stock value = closing stock × unit cost.
- Set reorder levels. Base them on average daily usage multiplied by supplier lead time, plus a safety buffer.
- Verify with a physical count. Count stock regularly using the Word count report and investigate any variance.
- Review and sign off. Add notes, have the report checked and file it with your monthly reports.
Inventory Formulas Used in the Excel Template
If you want to customise the spreadsheet, these are the key formulas behind it:
- Closing stock = Opening stock + Stock received − Stock issued
- Stock value = Closing stock × Unit cost
- Status = IF closing stock ≤ 0 then “Out of Stock”, IF closing stock ≤ reorder level then “Reorder”, otherwise “In Stock”
- Variance (count report) = Counted quantity − System quantity
- Inventory accuracy % = Items counted without variance ÷ Total items counted × 100
- Inventory turnover = Cost of goods sold ÷ Average inventory value
Tracking inventory turnover alongside your sales reports and daily sales reports shows which products move quickly and which tie up cash on the shelf.
Tips for Accurate Inventory Reporting
- Freeze stock movements while a physical count is in progress, or record a clear cut-off time.
- Count “blind” – counters should not see the system quantity until after they have counted.
- Use one unit of measure per item (for example boxes or pieces, not both).
- Recount any line where the variance is above an agreed tolerance before adjusting the books.
- Record damaged, expired and returned items separately so they are not counted as saleable stock.
- Keep each period’s report as a separate file or worksheet so you have an audit trail.
- Review slow-moving items monthly and include actions in your business analysis report.
Inventory Report vs. Stock Count vs. Expense Report
These documents are often confused. An inventory report tracks the quantity and value of goods over a period. A stock count report records what was physically found on the shelves on a specific day and compares it with the records. An expense report records money spent on business costs such as travel, supplies and services rather than goods held for sale. Most businesses use all three together to keep their records accurate.
Related Report Templates
If you manage stock you may also find these templates useful:
- Financial Report Templates – summarise revenue, costs and profit.
- Audit Report Templates – document internal checks and stock audits.
- Business Report Templates – present operational updates to management.
- Weekly Report Templates – share weekly stock and sales updates.
- Inspection Report Templates – record warehouse and quality inspections.
Frequently Asked Questions (FAQ)
What is an inventory report template?
An inventory report template is a pre-formatted document, usually in Excel or Word, that lets you record item details, opening stock, receipts, issues, closing stock and stock value without designing the layout yourself. You simply fill in your data and the template organises it into a clear report.
How do I make an inventory report in Excel?
List your items in rows with columns for item code, description, opening stock, received, issued, closing stock, unit cost and value. Use the formula closing stock = opening + received − issued and stock value = closing stock × unit cost. The free Excel template on this page already includes these formulas, reorder alerts and totals.
How often should an inventory report be prepared?
Most small businesses prepare an inventory report monthly, while busy retail and food businesses often do it weekly. A full physical count is usually carried out at least once a year, with smaller cycle counts during the year for high-value or fast-moving items.
What is the difference between perpetual and periodic inventory?
A perpetual inventory system updates stock records after every purchase and sale, so you always know the current balance. A periodic system updates stock only at set intervals, usually after a physical count. The Excel template works for both: update it continuously or at the end of each period.
How do I calculate inventory value?
Multiply the closing quantity of each item by its unit cost and add the results together. Businesses commonly use FIFO (first in, first out), weighted average cost or specific identification to decide the unit cost. Use the same method every period so your reports can be compared.
Can I use these inventory templates for free?
Yes. Both templates are free to download and fully editable. You can change the columns, add your logo and company details, and use them for personal or business purposes.
Will the templates work in Google Sheets and Google Docs?
Yes. You can upload the .xlsx file to Google Sheets and the .docx file to Google Docs. The formulas, conditional colour coding and tables will continue to work after upload.



You must be logged in to post a comment.