

Managing sales performance and tracking revenue trends are critical for maintaining financial stability and driving business growth. Whether you are conducting weekly sales reviews, forecasting quarterly revenue, or preparing annual financial summaries for leadership, having a structured reporting framework ensures accuracy and actionable insights.
Our collection of professionally designed Sales and Revenue Report Templates provides pre-formatted Excel spreadsheets and Word documents built to streamline your financial data collection, client tracking, and revenue analysis.
Why Use Standardized Sales & Revenue Reports?
Relying on fragmented spreadsheets or informal updates can lead to data discrepancies, missed targets, and misaligned strategic goals. Implementing standardized sales and revenue templates across your organization offers key advantages:
- Accurate Financial Tracking: Pre-built formulas in Excel models minimize manual calculation errors across sales volume, gross margins, net revenue, and tax deductions.
- Executive-Ready Visuals: Clean tables, built-in key performance indicator (KPI) highlight blocks, and summary charts make complex revenue metrics simple for leadership and stakeholders to review.
- Enhanced Performance Monitoring: Track individual sales rep achievements, product line profitability, regional distribution, and monthly revenue variance against budgeted forecasts.
- Time Efficiency: Eliminate the need to design financial reports from scratch, allowing your team to focus on strategic analysis and deal closing rather than document formatting.
Core Features of Our Excel & Word Templates
Each template in this library is crafted to balance detailed financial logging with clean, executive-level layout presentation:
- Fully Editable & Customizable: Adjust color schemes, add corporate branding, and modify table columns or financial formulas to match your specific accounting workflows.
- Automated Excel Data Models: Built-in formulas calculate totals, percentages, growth rates, and variances automatically.
- Structured Word Layouts: Designed for narrative context, enabling sales managers to present qualitative summaries alongside quantitative performance figures.
- Cross-Industry Application: Suitable for retail sales, B2B SaaS revenue, client service agencies, distribution networks, and e-commerce platforms.
Download Sales Revenue Report Templates:
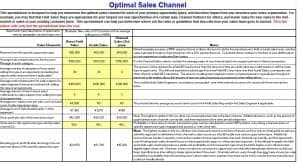
This optimal sales revenue report template provides a high-performing financial dashboard structure designed for executive leadership, financial analysts, and sales directors. The top section opens with prominent key performance indicator (KPI) summary blocks that highlight critical metrics at a glance, including total gross revenue, net profit margins, sales growth percentages, and average deal sizes. This upfront visual layout enables stakeholders to immediately gauge financial health before analyzing detailed revenue streams.
setup includes structured data tables and side-by-side comparative sections for tracking monthly, quarterly, and year-over-year revenue performance. Built-in columns accommodate breakdowns across multiple distribution channels, client accounts, product lines, and regional territories. Utilizing this optimal template streamlines recurring financial reporting, minimizes manual calculation errors, and delivers clean, data-driven insights for strategic revenue planning.

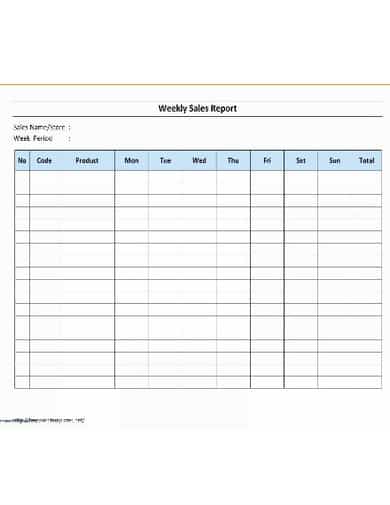
This practical weekly sales report template is engineered for sales managers and team leads needing to track short-term deal velocity, weekly targets, and individual representative performance. The opening section features a quick-reference summary block that captures total weekly revenue generated, percentage of target achieved, closed deal counts, and new leads added to the pipeline. This concise top-level summary gives management a clear snapshot of current sales momentum during weekly team meetings.
The internal structure provides organized data tables formatted for tracking daily sales activity from Monday through Friday. It includes dedicated columns for customer names, product or service categories, deal values, payment status, and assigned sales representatives. Utilizing this weekly reporting framework helps teams identify short-term conversion bottlenecks early, maintain accountability, and make real-time adjustments before month-end closing.
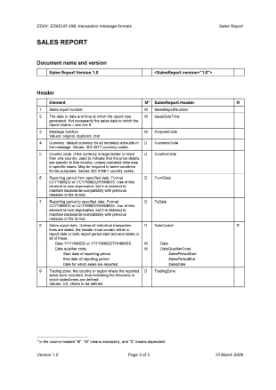
This versatile sales report template provides a comprehensive framework for tracking overall commercial performance, sales funnel metrics, and revenue figures across any business model. The document opens with a clear executive overview section, highlighting core commercial metrics such as total pipeline value, win/loss ratios, average deal velocity, and total closed revenue. This structured opening enables business owners and department heads to quickly assess sales operations without sifting through raw data logs.
The main body incorporates clean, multi-column data tables designed to categorize sales performance by representative, product category, customer segment, or geographic territory. Dedicated rows and columns allow for itemized logging of units sold, gross sales, applicable discounts, and net revenue figures. Utilizing this standardized sales report template streamlines routine reporting routines, maintains consistent historical records, and enhances visibility across the entire sales pipeline.
Frequently Asked Questions (FAQs)
What is the difference between a sales report and a revenue report?
A sales report primary focuses on volume, deal activity, conversion rates, and sales team output (e.g., units sold, calls made, leads closed). A revenue report focuses on the overall financial outcome, tracking gross income, recurring revenue streams, net income after discounts/returns, and financial variance against budgets. Many of our templates combine both metrics into a single cohesive document.
Are these templates compatible with Microsoft Office and Google Workspace?
Yes. The Excel templates (.xlsx) and Word templates (.docx) can be opened directly in Microsoft Office or uploaded to Google Sheets and Google Docs for seamless online editing and real-time team collaboration.
Can I customize the pre-built financial formulas in the Excel templates?
Absolutely. None of the cells or formulas are locked. You can easily modify existing formulas, add custom columns (such as commission structures, regional taxes, or currency conversions), or integrate dynamic chart visualizers.
Which template format should I choose: Excel or Word?
- Choose Excel if your primary goal is numerical tracking, automated totals, multi-product line analysis, and continuous data entry.
- Choose Word if you need to present an executive summary, quarterly review narrative, or formal presentation to board members and investors alongside high-level financial figures.

![18+ Practical Police Report Templates [in WORD & PDF]](https://www.reportsexcel.com/wp-content/uploads/2026/08/bf216f69-026b-4c3d-a43c-88f531ebc870-120x120.jpg)

You must be logged in to post a comment.