

Open almost any monthly safety report and the first thing you’ll see is a big number: days since the last lost-time injury, or the year’s TRIR, usually in green. Then a list of what went wrong. Then, if there’s room, a line about training.
That order is backwards, especially for a small or mid-sized site. This post argues for a different kind of safety report: one that starts with what the team is doing to prevent injuries, and puts injury rates second, read against honest benchmarks. Two free templates go with it. The Excel workbook calculates the rates and the leading indicators for you. The one-page Word report is built for a leadership meeting.
The examples use Kessler Metal Works, a fictional 85-person metal fabrication plant, for September 2026.
The case against leading with TRIR
The total recordable incident rate is a fine measure. It’s standard, it’s comparable, and customers and insurers ask for it. The problem is what it does to a monthly report at a site that works about 15,000 hours a month.
The formula is simple:
TRIR = number of recordable cases × 200,000 ÷ total hours worked
The 200,000 represents 100 full-time employees working 40 hours a week for 50 weeks. That makes the result “cases per 100 workers per year”. Now apply it to one month. Kessler had one recordable injury in January, during 14,200 hours. That month’s TRIR comes out at 14.08, more than four times the industry average. In February, with no cases, it was 0.00. Neither number tells you anything about whether the plant got more or less safe between January and February.
At this size, every recordable moves the rate a lot. For Kessler’s year-to-date hours, a single extra case adds 1.52 to the TRIR. A plant can do everything right and have a bad month, or do everything wrong and get lucky. Put that number first and you’ll spend the meeting arguing about luck.
What honest benchmarks look like
If you are going to show injury rates, show them year to date, and next to the right comparison. The US Bureau of Labor Statistics publishes rates by industry every year. The most recent figures, for 2024, are:
| Comparison (BLS, 2024) | TRIR | DART |
|---|---|---|
| All private industry | 2.3 | 1.4 |
| Manufacturing | 2.7 | 1.7 |
| Fabricated metal product manufacturing (NAICS 332) | 3.2 | 1.8 |
| Kessler Metal Works, Jan–Sep 2026 | 3.03 | 1.52 |
Two points stand out. First, compare against your own industry, not the national average. Kessler looks poor next to “all private industry” (2.3), and slightly better than the typical metal fabricator (3.2). Both comparisons are true. Only one is fair. Second, being average isn’t a goal. Kessler’s own target is 2.0, and the template shows both the target and the benchmark so nobody can hide behind “below industry average”.
DART counts cases with days away, restricted work or job transfer, using the same 200,000-hour formula. It’s often the more telling rate, because it filters out minor recordables and focuses on injuries that actually took someone off their normal job.
What to lead with instead: leading indicators
Leading indicators measure the activity that prevents injuries. They change every month, they’re under the team’s control, and they give the meeting something to act on. The template tracks four:
| Indicator | Kessler, September | Why it matters |
|---|---|---|
| Near misses reported | 12 (up from 3 in January) | A rising count usually means people trust the system enough to report, not that the plant is getting more dangerous |
| Inspections done vs planned | 8 of 8 (94% YTD) | Shows whether the basic routine is actually happening |
| Corrective actions closed on time | 7 of 7 (88% YTD) | Reporting hazards means nothing if the fixes drift |
| Near misses per recordable | 32.5 : 1 | A rough gauge of reporting culture; higher is healthier |
A note on that last one. You’ve probably seen the “safety triangle” claiming a fixed ratio of near misses to minor injuries to serious ones. Those historical ratios don’t hold up well as predictions, and serious injuries often have causes that minor ones don’t. Use the ratio as a sign of how willing people are to report, not as a forecast.
The Excel template: rates without the arithmetic
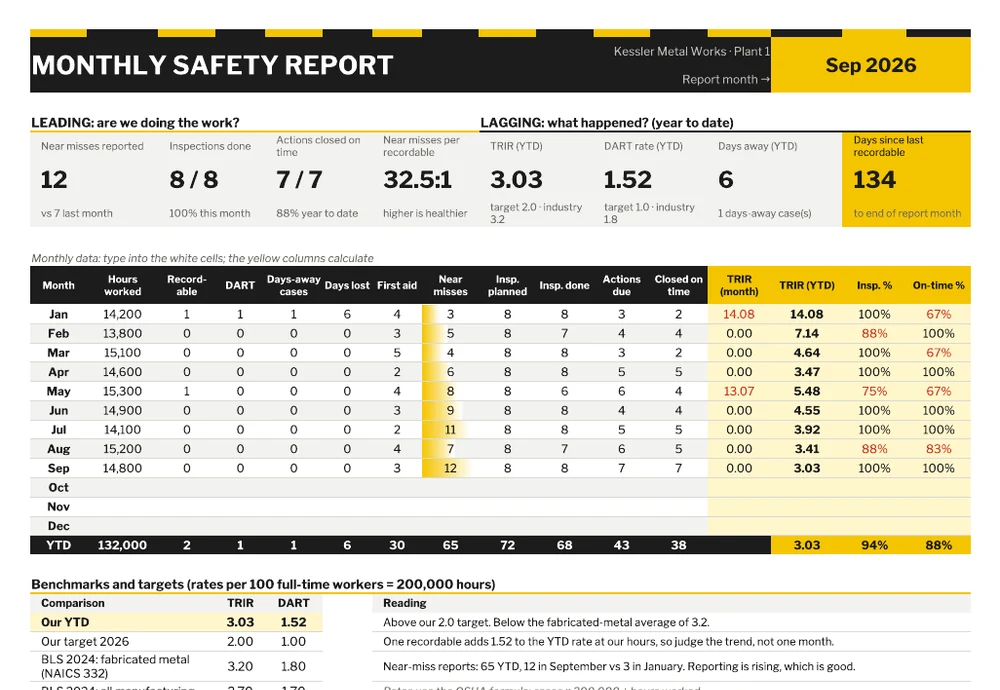
Each month you type one row: hours worked, recordables, DART cases, days-away cases and days lost, first aid, near misses, inspections planned and done, and corrective actions due and closed on time. The yellow columns calculate the monthly TRIR (included so you can see how noisy it is), the year-to-date TRIR, and inspection and on-time percentages.
Change the report month in the top-right cell and every tile updates. The leading indicators sit on the left, and the lagging ones sit on the right, measured year to date. Days since the last recordable counts from a date you enter. The benchmark block compares your year-to-date rates with your target and the three BLS figures, and writes a plain-English reading. In September it says: “Above our 2.0 target. Below the fabricated-metal average of 3.2.”
A second tab, Event Log, records each near miss, first-aid case and injury, with the corrective action, owner, due date and status. Open actions that are getting close to their due date turn red.
The Word template: one page for the leadership meeting
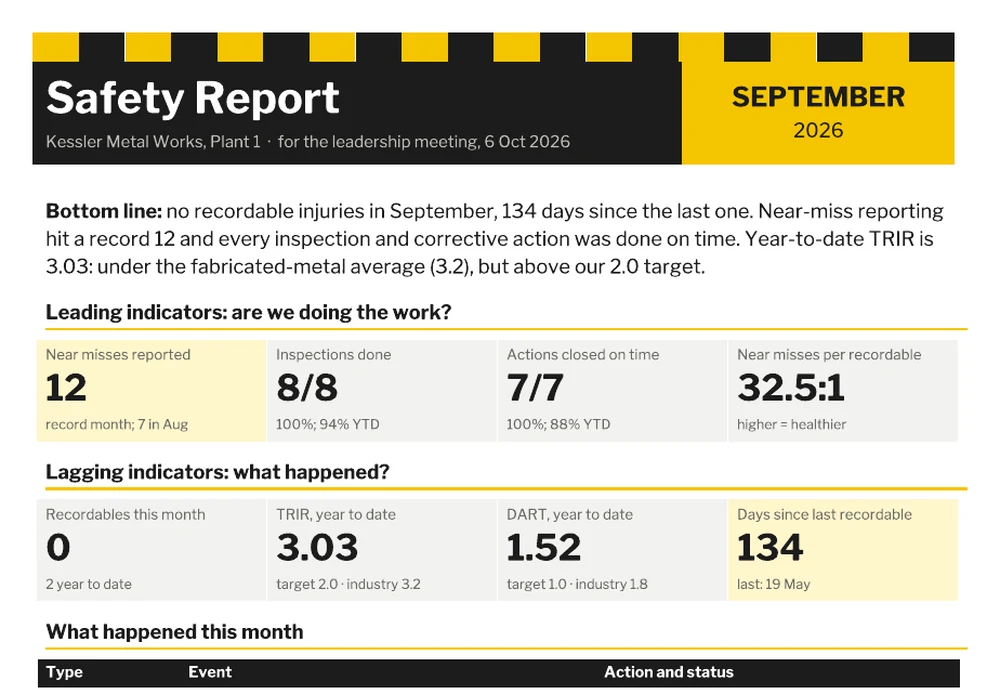
The Word report follows the same argument on paper. It opens with a bottom line in two sentences. Leading indicators come next, then lagging ones, then a short table of what actually happened, with the action taken and whether it’s closed. It ends with three things to focus on next month. The focus list is the part that turns a report into a decision. In the sample, a damaged rack upright and a run of sheet-edge cuts become October’s two priorities.
Five rules for a safety report people actually read
- Put the trend before the number. “TRIR 3.03, down from 4.64 in March” beats “TRIR 3.03” every time.
- Report rates year to date (or rolling 12 months). Monthly rates at small sites are mostly noise. The template shows both so you can make the point.
- Never celebrate low near-miss numbers. A month with zero near misses at a busy plant usually means nobody reported, not that nothing happened.
- Name the action, the owner and the date. “Racking upright to be replaced, Maintenance, 12 Oct” can be followed up next month. “Racking issue noted” can’t.
- Keep it to one page for leaders. The detail lives in the workbook and the event log. The report is for decisions.
Where the safety report fits
The monthly safety report summarizes. It doesn’t replace the documents underneath it. Each injury or serious near miss should have its own incident report. Workplace walk-throughs belong on inspection reports. Periodic reviews of the safety system itself are what an audit report is for. If safety is one of several areas you report on each month, the same leading-versus-lagging thinking works in a KPI report.
One practical note for US employers. “Recordable” has a specific meaning under OSHA’s recordkeeping rules. Broadly, it covers work-related injuries and illnesses that need medical treatment beyond first aid, cause days away or restricted work, or meet certain other criteria. The same cases go on your OSHA 300 log, and the yearly summary (Form 300A) has to be posted from February 1 to April 30. If your monthly report and your 300 log ever disagree, the log wins. Fix the report.
The counter-argument, briefly
Lagging indicators aren’t useless. Insurers price premiums partly on loss history. Customers use TRIR to prequalify contractors. A serious injury is the outcome everyone is trying to prevent, and it deserves first billing in the month it happens. The argument here is about order and emphasis, not about leaving rates out. Lead with what the team controls. Read the rates against a fair benchmark. When the two disagree, for example when activity is high but injuries are still rising, that’s the most useful thing your safety report can tell you.