

A daily production report looks like a form you fill in at the end of a shift. On a well-run line, it’s filled in during the shift, an hour at a time, and by the time the shift ends it has usually shown the supervisor something they didn’t expect. To show how that works, this page follows one shift on one line from 05:45 to 14:00, with the template being filled in as the shift goes.
The supervisor is T. Okonkwo, running shift A on Line 3 at Riverbend Foods, a granola bar plant. The company, the people and the numbers are all illustrative, but the problems they run into come up on real lines every day. Both templates are linked below: the Excel daily production report format with working formulas for hourly output, downtime and OEE, and a Word shift report for the handover.
05:45 · Before the line starts
Okonkwo opens a fresh copy of the report and fills in the header: date, shift, product (oat and honey, 40 g, SKU GB-40) and her name. Then she sets the hourly targets. The line is rated at 40 bars a minute, or 2,400 an hour. The plant plans to 85% of that, so the target is 2,040 for a full hour and 1,530 for the two hours that include a 15-minute break. The shift target comes to 15,300.
Setting the targets before the shift is the point. If you set them afterwards, it’s tempting to set them to whatever happened. Most plants pre-fill them from the production schedule, and the template lets you type over them hour by hour when a changeover or a short run means the plan is different.
06:07 · First bars, and a slow first hour
Start-up takes seven minutes: film threaded, jaws up to temperature, first seal check passed. At 07:00 she enters 1,980 in the 06:00 row. The cumulative columns fill in: 2,040 target, 1,980 actual, −60. It’s a small miss and it’s red, but every first hour looks like this. She writes “Start-up, first bars at 06:07” in the notes, because otherwise someone reading the report next month will wonder about it.
The cumulative variance column is the most useful thing on the sheet. Hourly figures go up and down. A cumulative gap that keeps growing means the shift isn’t going to recover by working harder in the last hour. The formula is simply =SUM($D$10:D13)-SUM($C$10:C13), total actual so far minus total target so far.
09:12 · The jam
Film catches in the sealing jaws on station 2. Maintenance arrives, finds the jaw heater reading 12 °C low and resets it. The line restarts at 09:46. Okonkwo opens the downtime log and types the start time, the end time, the code MECH and one line about what happened. The template works out the minutes (=ROUND((C22-B22)*1440,0), because Excel stores time as a fraction of a day and a day has 1,440 minutes): 34.
The 09:00 row comes in at 1,150 against 2,040, and the cumulative gap jumps from −160 to −1,050. If anyone asks later what went wrong on Wednesday, this is the hour they’ll point to.
Two things she gets right here, and that are often missed. She logs the stop when it happens, not from memory at 13:55. And she picks a code from the list (MECH, ELEC, MAT, CHG, QA, STAFF, OTHER) instead of writing “breakdown”. Codes are what let you total downtime by cause at the end of the month, and that’s how you find out whether jams, changeovers or missing materials cost you the most time.
10:15 · QA slows the line
After the jam, QA asks for the line to run at 36 bars a minute until the seals have proved stable. That’s a sensible precaution. Nobody writes it in the downtime log, because nothing has stopped. Keep this in mind for later.
11:05 · The planned changeover
The wrapper changes from the 38 g film to the 40 g film. It’s planned, so it’s logged with code CHG and Planned = Yes. It takes 12 minutes against an 8-minute standard. Plants treat planned stops differently. Some leave them out of availability, and others count them because changeover time is still time the line isn’t making product. This template counts them, so a long changeover shows up in the figures instead of disappearing.
12:05 · Checking the trend
The cumulative variance stands at −1,380. Okonkwo looks at the notes column alongside it and sees the pattern straight away: the jam hour, the changeover hour, and the 08:00 break hour, which came in below even its reduced target. The 10:00 hour, the one clean full hour since the jam, was 2,010. That’s close to target, but not above it, which would be normal after a stoppage, when there’s ground to make up. She notes it.
13:20 · The label reel
The label reel runs out and there isn’t a spare at the line. Someone fetches one from stores. That’s eight minutes, code MAT, and it’s the second time this week. She writes “spare not staged at line” in the reason column. That’s the cause. “Out of labels” would only describe the symptom.
13:40 · OEE says something different
The bottom block of the template works out OEE (overall equipment effectiveness) from the figures entered during the shift:
| Factor | Formula | Line 3, shift A |
|---|---|---|
| Availability | Run time ÷ planned time = (450 − 54) ÷ 450 | 88.0% |
| Performance | Ideal cycle × total units ÷ run time = 1.5 s × 13,560 ÷ (396 × 60) | 85.6% |
| Quality | Good units ÷ total = 13,310 ÷ 13,560 | 98.2% |
| OEE | 88.0% × 85.6% × 98.2% | 73.9% |
Next to it, the template names the largest of the three losses: Biggest loss: speed, running below 40 bars/min. That isn’t the jam. The jam and the other two stops cost 12 points of availability. Running slowly cost more than 14 points of performance. While it was running, the line averaged about 34 bars a minute: 13,560 bars in 396 minutes. Nobody logged that loss, because nothing stopped.
This is what OEE is for. Downtime is easy to see. Somebody has to get up and fix it. Slow running doesn’t get noticed, because the line is running and nobody calls it a problem. The reduced speed QA asked for at 10:15 was a sensible call. Leaving it in place for four hours wasn’t, and without the calculation nobody would have noticed.
14:00 · Handover
Okonkwo fills in the Word shift report in about five minutes. Most of it is copied from the spreadsheet: the shift numbers, OEE, and the stops table with times and codes. The part she writes herself is the handover to shift B, numbered so nothing gets lost in a paragraph. Watch the seal temperature on station 2 and stop below 185 °C. Return to 40 a minute once three seal checks in a row pass (QA has agreed). A spare label reel is now staged at the line. About 2.5 hours of 40 g film is left. Both supervisors sign it.
It’s a short report, and that’s deliberate. If it runs to two pages, the incoming supervisor will skim it at 14:05.
The Excel daily production report format
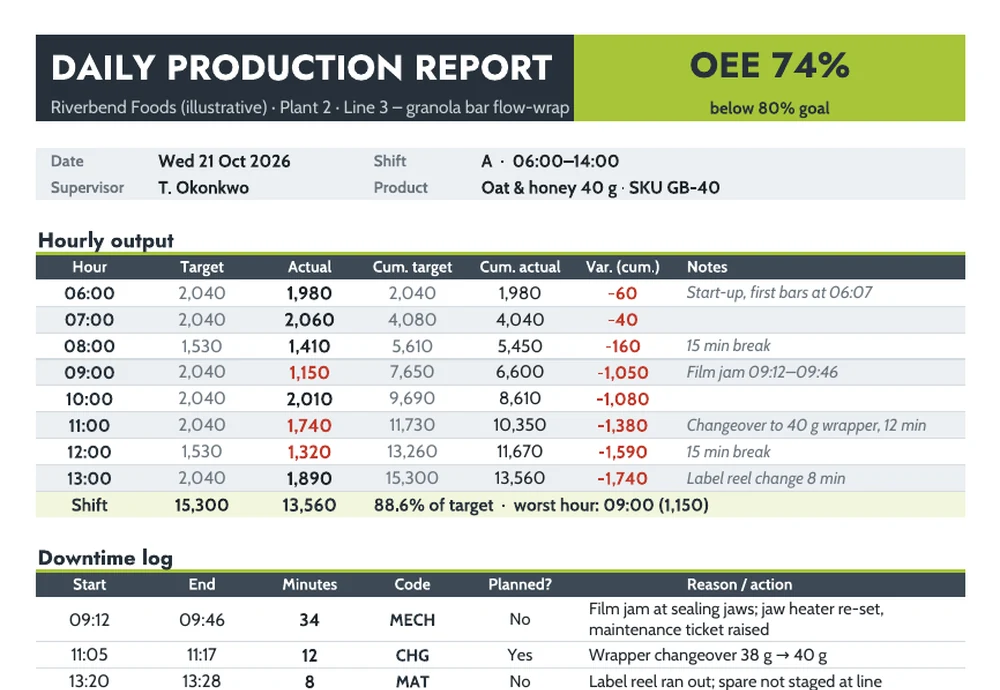
One sheet, one shift. It contains the header, eight hourly rows with cumulative target, actual and variance, a shift total line that names the worst hour, a downtime log with codes and a Planned yes/no dropdown, and the OEE block with good units calculated from scrap and rework. Hours that come in more than 10% below target turn red. Change the planned time, the ideal cycle time and the hourly targets to match your line. Everything else follows from the figures you enter. For a 12-hour shift, insert rows inside the hourly table and the totals will expand to include them.
The Word production shift report
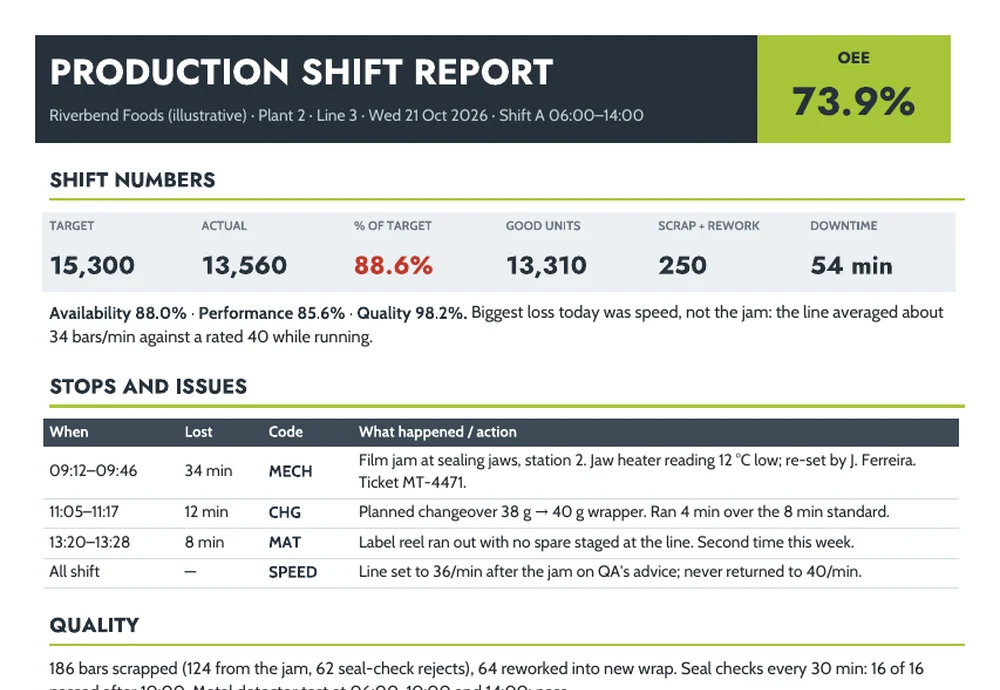
This is the handover document: the headline numbers, one sentence on the biggest loss, the stops table, a quality note (scrap by cause, seal checks, metal detector tests) and the numbered handover list. It works alongside the end of shift report if your site uses one for general operations, and the open maintenance tickets it mentions can be followed up in a maintenance report.
What Okonkwo would tell a new supervisor
- Fill it in every hour. A report written from memory at the end of the shift is a guess.
- Log every stop over two minutes with a code. Shorter stops will show up as lost performance anyway.
- Write causes, not symptoms. “Spare reel not staged” can be fixed. “Out of labels” can’t.
- Look at the OEE breakdown before you write the handover. The biggest loss is often not the one everyone talked about.
- Roll the daily reports into a weekly downtime-by-code summary. The KPI report is a good place to track OEE over time.
Riverbend Foods, its staff, line data and all figures are illustrative.

