

Most first drafts of a quarterly report look much the same. There are eleven pages, a few charts copied out of the accounting system, a paragraph per department about what they’ve been busy with, and the revenue figure on page six. Everything is there, but a reader has to dig to find out whether it was a good quarter.
This page takes a draft like that apart and rebuilds it. The business is Hollis & Grey Coffee Roasters, an illustrative wholesale roaster with one café and an online shop, reporting on Q3 2026. Each section below sets a line from the weak draft against the finished version and explains what changed. At the end you can download both finished files: an Excel quarterly report workbook that calculates the scorecard, and the Word quarterly report the owners actually read.
What the reader of a quarterly report needs
Before getting into the fixes, it’s worth being clear about the job. Owners, a board or investors read a quarterly report to answer four questions: How did we do against the plan? Why? What are we doing next quarter? What do you need from us? Monthly reports track operations. An annual report tells the story of a full year. The quarterly sits between the two. It’s long enough to show trends, and short enough that you can still change course before year end.
Anything that doesn’t help answer one of those four questions belongs in an appendix, or nowhere.
Fix 1 — Put the result in the first three sentences
| Draft | Final |
|---|---|
| “Q3 was a busy quarter for the team. In July we welcomed two new baristas and began work on the subscription relaunch…” | “Revenue reached $719,400, up 7.5% on Q2 and 12.4% on Q3 last year, but 2% short of the $735,000 target…” |
The draft opens with activity. The final version opens with the outcome: the headline number, how it compares with last quarter, last year and the target, and the single biggest reason for the gap. If a reader stops after three sentences, they still know how the quarter went. The Word template has a section called The quarter in three sentences to make you write this first. The Excel scorecard builds a version of the same sentence automatically from the figures.
Fix 2 — Every number needs something to compare it with
| Draft | Final |
|---|---|
| “Gross margin: 44.3%” | “Gross margin 44.3% · +1.2 pts on Q2 · target 44.0% · met” |
On its own, 44.3% doesn’t tell a reader anything. Is that up? Down? Good? A useful quarterly scorecard compares each measure in three directions: the previous quarter (short-term trend), the same quarter last year (which takes out seasonality, and that matters a lot for a coffee business with a December peak), and the target.
The Excel workbook lays this out as columns: Q3 2026, Q2 2026, change vs Q2, Q3 target, result vs target, Q3 2025. Percentages change in points, not percent. Going from 43.1% to 44.3% is +1.2 pts, and calling it “+2.8%” would confuse half the room. The formula is simply =(C10-D10)*100 with a ” pts” number format.
Fix 3 — Show whether each target was met
| Draft | Final |
|---|---|
| Targets in a separate budget file | A ✓/✗ result column, colour-coded, with the size of any miss |
Most people reading the report will look at the result column first. The workbook works it out for each row and knows which direction counts as good. For revenue, higher is better. For operating expenses, lower is. So when spending came in 1% over budget, it shows ✗ +1% in red rather than a green tick for “beating” the number. Hollis & Grey met four of eight measures in Q3. That’s an honest picture of the quarter. A list of numbers on its own wouldn’t show it.
Choose six to ten measures and keep them the same every quarter. If you switch them around, the reader can never compare one quarter with the next. If you need help deciding which measures matter, the KPI report guide covers how to choose them.
Fix 4 — Explain the variances instead of just describing them
| Draft | Final |
|---|---|
| “September café sales were slower than expected.” | “Café down 9.9% in September vs August. Mill Road street works ran 2–27 September; weekday transactions fell from about 410 to 330 a day, and October is already back to 400.” |
The draft gives no cause and no sense of scale, so the reader can’t tell whether to worry. The final version gives the size of the drop, what caused it, the evidence, and whether it’s still happening. That fourth part matters most. A drop caused by something temporary needs a different response from a lasting change in demand.
Explain the two or three biggest variances, good and bad, and leave the rest. Wholesale being 9.6% up is a variance as well. Explaining what went right (offices returning to five-day weeks) tells the owners where the next quarter’s growth is likely to come from.
Fix 5 — Say what didn’t work, plainly
| Draft | Final |
|---|---|
| (No mention of the late relaunch) | “The online subscription relaunch went live three weeks late (14 Aug instead of 24 Jul), which explains most of the shortfall in online orders.” |
Readers notice what’s missing. Online orders were 4% short of target. If the report doesn’t say why, someone will ask in the meeting, and then the late launch looks like it was being hidden. Giving it its own short section, What didn’t work, makes it routine to include, and the report reads as more credible for it.
Fix 6 — Give next quarter’s priorities an owner and a measure
| Draft | Final |
|---|---|
| “Q4 focus: growth, the holiday season and café recovery.” | “Holiday gift boxes online, live by 3 Nov · Owner A. Hollis · 900 boxes; online AOV ≥ $26.” |
“Growth” isn’t a priority. It’s a hope. Each priority in the final version has one owner, a success measure and a date, and there are three of them. With seven, the team would end up working on none of them properly. Next quarter’s report then opens by reviewing these three against their measures. That habit is what makes the report worth writing.
Fix 7 — End with the decisions you need
The draft ended with “thanks to the whole team for their hard work.” The final version ends with two decisions for the owners: approve a second roaster shift ($6,800 a month) if wholesale passes 60 accounts, and agree whether to match a competitor’s 6% discount to win back a lost office account. A quarterly review is often the only time everyone who can make those decisions is in the same room, so the report should ask for them.
The checklist: what good looks like
| Section | Good looks like | Length |
|---|---|---|
| Headline | Result vs Q2, last year and target, plus the main reason | 3 sentences |
| Scorecard | 6–10 fixed measures, three comparisons, met/missed | 1 table |
| Drivers | 2–3 biggest variances with cause, size and evidence | 3 bullets |
| What didn’t work | Misses and delays, stated plainly | 1 paragraph |
| Next quarter | 3 priorities, each with an owner, measure and date | 1 table |
| Decisions | Specific asks with costs | 2–3 lines |
That comes to two pages. Hollis & Grey’s draft was eleven. The detail didn’t go away. It’s in the workbook for anyone who wants it.
Template 1: the Excel quarterly report workbook
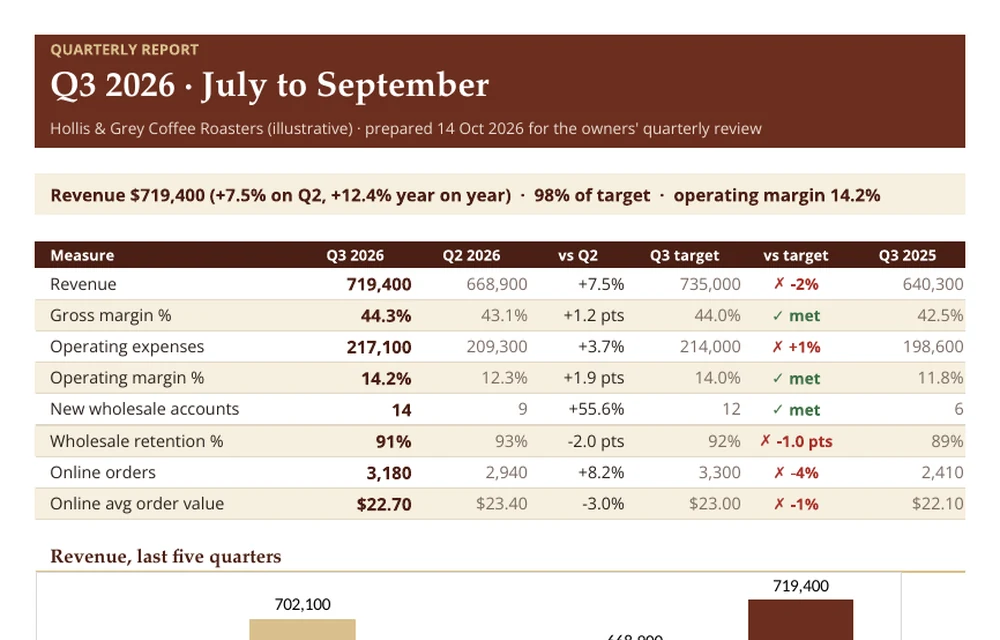
The Monthly Detail tab holds the three months of the quarter: revenue by channel, cost of goods, gross profit and margin, operating expenses, operating profit and two operating counts. It totals the quarter and works out margins on the totals. That matters, because averaging three monthly margins gives the wrong answer when the months are different sizes. The Q3 Scorecard tab pulls those totals into the comparison table, writes the headline sentence, and charts the last five quarters with the current one highlighted.
To roll it forward, copy the workbook, type the new quarter’s months over the old ones, move this quarter’s figures into the “previous quarter” column, and update the targets. The headline sentence and the results update themselves. If your income statement lives elsewhere, the monthly figures can come straight from your P&L template.
Template 2: the Word quarterly business report
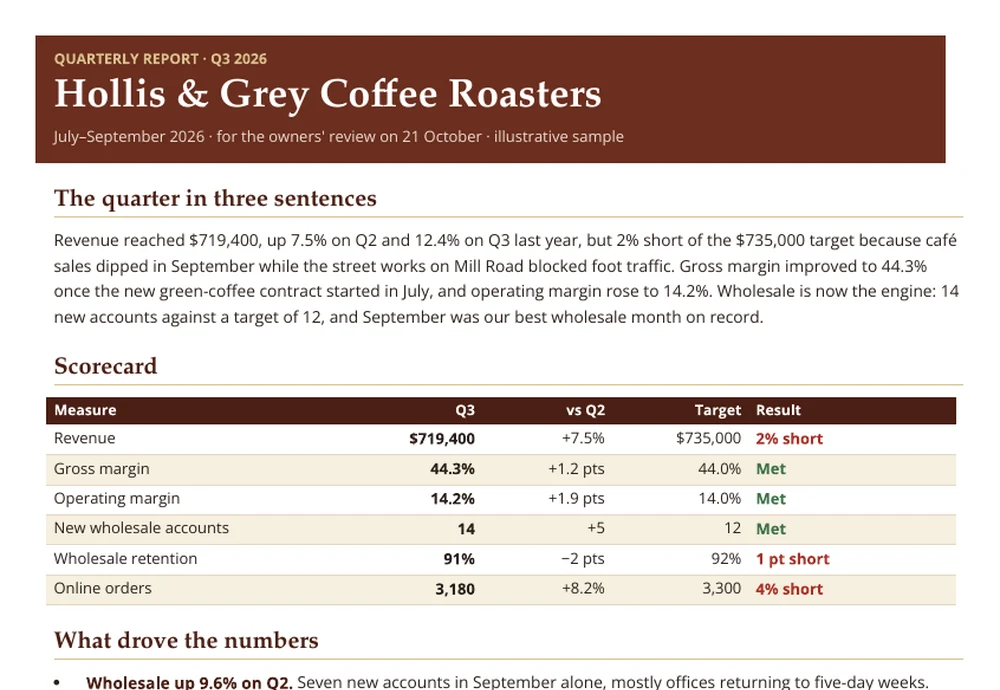
This is the finished version of the teardown: the three-sentence headline, a six-line scorecard, drivers, what didn’t work, three Q4 priorities and the decisions needed, all in about two pages. The section headings act as prompts. Replace Hollis & Grey’s text with your own and keep the order.
If you report monthly as well, keep the two separate. The monthly report tracks operations, and the quarterly looks at results against the plan. For a broader write-up for a lender or partner, the business report template has a fuller structure.
Hollis & Grey Coffee Roasters, its people, customers and figures are illustrative.

