

An after action report answers four questions, in order. What was supposed to happen? What actually happened? Why was there a difference? What will we do about it? That’s the whole method. The format comes from the US Army, which began using after-action reviews in the 1970s. It has since been picked up by emergency managers, hospitals, software teams and anyone else who wants to learn from a project without turning the debrief into a blame session.
This page is built around those four questions. Each section explains what a good answer looks like, shows a weak and a strong version side by side, and points to the part of the templates where it goes. There are two free downloads: an Excel tracker with a plan-vs-actual timeline and an action log, and a one-page Word AAR.
The sample used throughout is fictional: Harbor Point Logistics, a distribution company that moved its six loading docks onto a new warehouse management system (WMS) over one weekend in October. It didn’t go entirely to plan, which makes it a good example.
Question 1: What was planned?
Start with the intent, written as it was understood before the event. Not what people wish they’d planned, and not a summary of the outcome. If there was a project plan, runbook or exercise objective, quote it. If there wasn’t, that’s your first finding.
A good answer includes a measurable definition of success. Without one, question 2 has nothing to compare against. For Harbor Point, the plan was: freeze the old system Friday at 18:00, go live Sunday at 18:00, ship Monday’s first wave at 06:00 at full volume, and get 95% of Monday’s orders out the same day with no stock errors.
| Weak | Strong |
|---|---|
| “Migrate to the new WMS over the weekend.” | “Freeze Fri 18:00, live Sun 18:00, first wave Mon 06:00; 95% of Monday orders shipped same day; zero stock errors.” |
Question 2: What actually happened?
This is the factual record: times, numbers and observations. Get it from logs, tickets, timestamps and the people who were there, not from memory alone. Keep interpretation out of this section. “Testing ran 3.5 hours late” is a fact. “Testing was badly managed” is a judgment, and belongs (if anywhere) in question 3.
The Excel tracker handles this with a milestone table. Enter planned and actual times, and it calculates how late each step ran and labels it on time, slipped (up to 2 hours) or late. At Harbor Point, the first three milestones slipped by an hour or two. Integration testing ran 3.5 hours late. Then the dock hardware check came in 9.3 hours late, when it turned out the label printers at two docks couldn’t print the new labels. Go-live moved to 23:40 Sunday, and the system was down for 53.6 hours instead of 48.
A second table records results against targets. Monday’s same-day shipping reached 71% against a 95% target. Inventory accuracy, on the other hand, came out at 99.8%, better than the 99.5% goal. Including the good result matters. It’s evidence that the data migration process worked and should be kept.
| Weak | Strong |
|---|---|
| “There were some printer issues and go-live was delayed.” | “Dock hardware check finished Sun 19:20 (planned 10:00). Docks 4 and 5 couldn’t print labels. Go-live 23:40 (+5.7 h). Monday: 71% shipped same day vs 95% target.” |
Question 3: Why was there a difference?
Now explain the gaps. Separate the root cause, the thing that if fixed would have prevented the problem, from contributing factors that made it worse. Ask “why” more than once. The printers failed because the drivers didn’t support the new label format. That happened because nobody tested those printers. Nobody tested them because the test lab only had one printer model, a newer one. That last answer is the one you can actually fix.
Two contributing factors also made the AAR. There was no go/no-go checkpoint before Sunday, so a delay that was visible by Saturday night wasn’t escalated until Sunday afternoon. And floor training had happened three weeks earlier, so the night shift was still unsure on the new scanners when Monday’s backlog hit.
Focus on conditions and decisions, not individuals. “The test plan didn’t include hardware” leads to a fix. “Sam forgot the printers” leads to Sam keeping quiet next time.
| Weak | Strong |
|---|---|
| “Poor planning by the IT team.” | “Root cause: older printers at docks 4–5 were outside test scope; the lab had one printer model. Contributing: no go/no-go gate before Sunday; training 3 weeks before go-live.” |
Question 4: What will we sustain, and what will we improve?
Every finding should end up in one of two lists. Sustain covers what worked and should be repeated deliberately, not left to luck. Improve covers what needs to change. Each item gets one owner and a due date. An AAR with no actions is a meeting summary, and an action with three owners has no owner.
Harbor Point’s review produced eight actions. Two were sustains: keep the data validation scripts as a standard step (they’re the reason inventory came out at 99.8%), and keep the hourly war-room call. Six were improvements, including adding every printer and scanner model to the test lab, putting go/no-go gates at Saturday 22:00 and Sunday 10:00 in the runbook, and writing a rollback rule that says what triggers a rollback, who decides, and by when.
| Weak | Strong |
|---|---|
| “Improve testing next time.” | “Add every printer and scanner model on site to the test lab. Owner: S. Patel. Due 31 Oct.” |
Template 1: the Excel after action report tracker
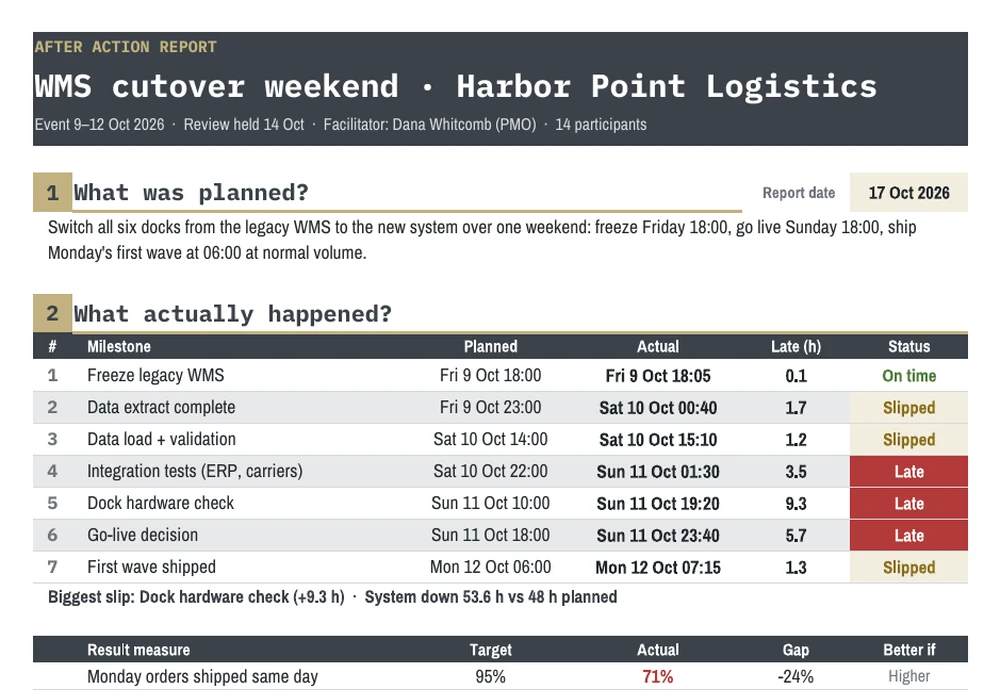
The AAR Summary tab follows the four questions top to bottom. Question 2 has the milestone table and a results table that colors each actual figure green or red, depending on whether higher or lower is better for that measure. A summary line picks out the biggest slip automatically and compares actual downtime with the plan. Question 4 shows open, overdue and completed actions from the second tab.
The Actions tab is the part that keeps working after the meeting. Each action has a type (sustain or improve), an owner, a priority, a due date and a status. Days late are calculated against the report date at the top of the summary, so the overdue count updates whenever you change that date. Finished actions turn grey so the open ones stand out. In the sample, two of eight are done, and two are already overdue a few days after the review. That’s normal, and it’s exactly why the log exists.
Template 2: the one-page Word AAR
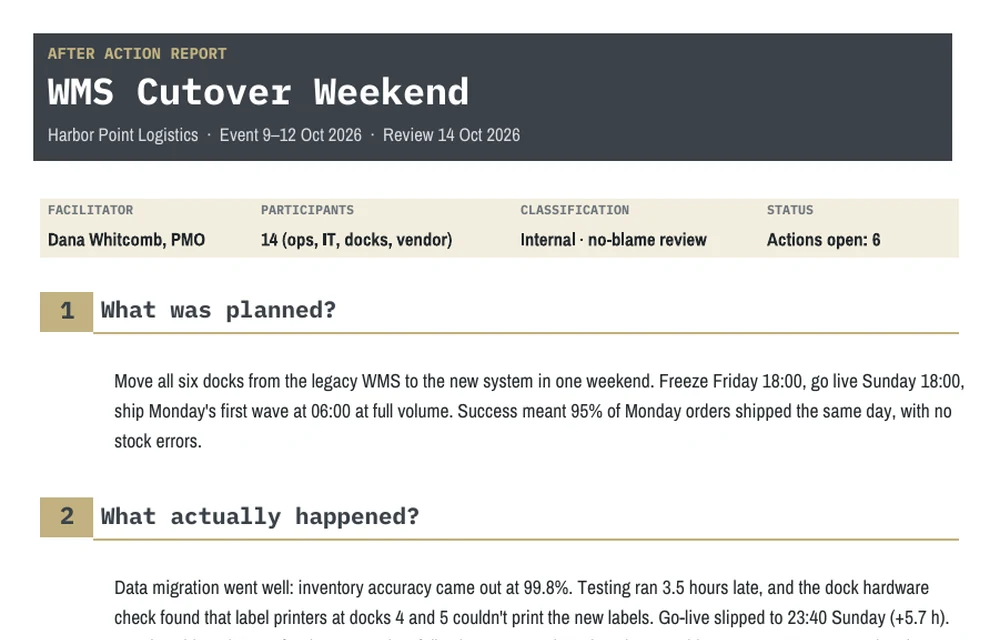
The Word version is what you circulate. It has a header with the event and review dates, a details strip (facilitator, participants, classification, open actions), and the four questions as numbered sections. Questions 1 and 2 are short paragraphs. Question 3 separates root cause from contributing factors. Question 4 is a small action table with sustain rows shaded so they don’t get lost among the fixes. A footer line records the ground rules the group agreed to, which is a useful reminder for anyone reading it later who wasn’t in the room.
Running the review itself
The report is only as good as the conversation behind it. A few habits make a real difference:
- Hold it within a few days. Harbor Point met three days after go-live. After a week, people remember a tidier version of events.
- Invite the people who did the work. That means dock leads and the night-shift supervisor, not just managers and the vendor.
- Use a facilitator who wasn’t in charge. Ideally someone from outside the team, so people talk to the facts rather than to the boss.
- Agree on ground rules out loud. No blame, rank left at the door, facts before opinions.
- Spend the time where it counts. A rough split for a 60-minute review: 10 minutes on the plan, 20 on what happened, 20 on why, and 10 on actions.
Small events can use a 15-minute “hot wash” straight afterwards, covering the same four questions. Big ones deserve the full written report.
After action report vs. other reports
An AAR covers a whole event or project, including the parts that went well. That’s what separates it from its neighbors. An incident report records one specific event, such as an injury, outage or near miss, usually soon after it happens. A problem report digs into a single recurring fault. And a project report tracks progress while the work is still going on. Teams often use all of them: incident reports during the event, then an AAR afterwards that pulls the lessons together.
Whichever you write, end with the fourth question. If nobody’s name is next to an action, the same problem will probably turn up again in the next review.