

A payroll report template gives you one clear, repeatable record of what every employee earned in a pay period, what was withheld from their pay, and what the payroll actually cost your business. Instead of piecing together timesheets, pay stubs and tax notices, a payroll report lays out hours, gross pay, taxes, deductions and net pay line by line, then totals everything so you know exactly how much to fund, deposit and record.
Below you can download two free, fully editable templates. The first is an Excel payroll report that works as a payroll register: it calculates regular pay, overtime, gross pay, 401(k), federal and state income tax, Social Security, Medicare and net pay for each employee, then rolls the results into a department summary and a tax liability schedule. The second is a Word payroll summary report you can send to an owner, controller or accountant: it presents the headline totals, payroll by department, an earnings and deductions breakdown, the taxes to remit and an approval block on a clean, printable page.
What Is a Payroll Report?
A payroll report is a summary of employee compensation for a specific pay period, such as a week, two weeks or a month. For each employee it shows hours worked, pay rate, gross earnings, every tax and deduction taken out, and the final net pay. At the bottom it totals those amounts and usually adds the employer’s share of payroll taxes, which gives you the full cost of the payroll.
Most payroll reports have two levels. The detail level, often called the payroll register, lists every employee on its own row. The summary level groups the figures by department, location or pay type and lists the tax and benefit amounts that must be paid to government agencies, insurers and retirement plans. Together they answer three questions: what did we pay, what do we owe, and where did the cost go?
A payroll report is also a control document. Gross pay minus total deductions must equal net pay, net pay must match the amount that leaves your bank account, and the withholding totals must match your tax deposits and quarterly filings.
Why Use a Payroll Report?
Payroll is usually one of the largest expenses a business has, and mistakes are costly for both employees and employers. A consistent payroll report helps you:
- Pay people correctly. Seeing hours, rates, overtime and deductions side by side makes it easy to catch a missing timesheet or a wrong rate before payday.
- Fund payroll and plan cash. Net pay plus tax and benefit remittances tells you exactly how much cash you need and when it leaves the account.
- Stay on top of tax deposits. The liability totals show how much federal income tax, Social Security, Medicare and state tax to deposit and by which date.
- Record accurate journal entries. Gross wages, employer taxes and each withholding liability map directly to accounts in your general ledger.
- Control labor costs. Department totals and overtime figures reveal where payroll is growing and whether overtime is becoming routine.
- Support audits and filings. Payroll reports back up quarterly Form 941 filings, year-end W-2s, workers’ compensation audits and lender requests.
Free Payroll Report Templates (Editable)
Both templates use the same sample company and the same September 14–27, 2026 biweekly pay period, so you can see how the detailed spreadsheet and the written summary fit together.
1. Payroll Report (Excel)
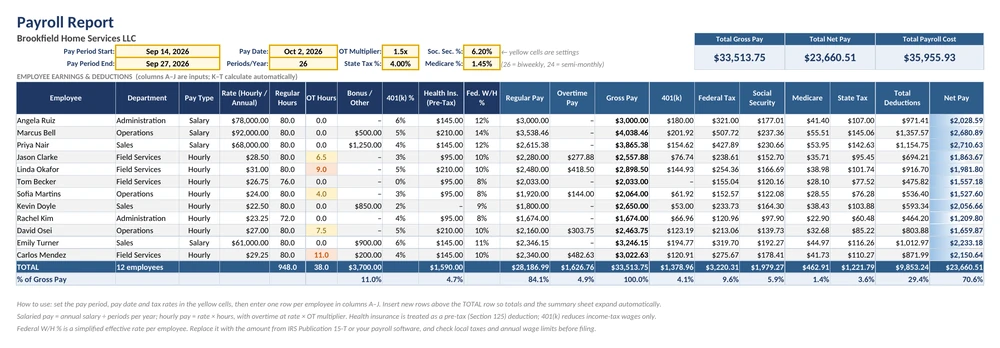
This workbook is the working tool. On the Payroll Register sheet you set the pay period, pay date, pay periods per year, overtime multiplier and tax rates in the yellow cells, then enter one row per employee: name, department, pay type (Hourly or Salary), pay rate, regular hours, overtime hours, bonus, 401(k) percentage, pre-tax health insurance and federal withholding rate. Regular pay, overtime pay, gross pay, every deduction and net pay calculate on their own, and cards at the top show total gross pay, total net pay and total payroll cost.
The Payroll Summary sheet uses SUMIFS and COUNTIF to total headcount, hours, gross pay, pre-tax deductions, employee taxes, net pay and employer FICA for each department, with a bar chart of payroll cost. A tax and deduction liability table shows the employee share, employer share and total to remit for each item, and a built-in check confirms that gross pay minus deductions equals net pay.
Best for: small business owners, bookkeepers and office managers who run payroll in a spreadsheet or want to double-check the figures from their payroll software.
2. Payroll Summary Report (Word)
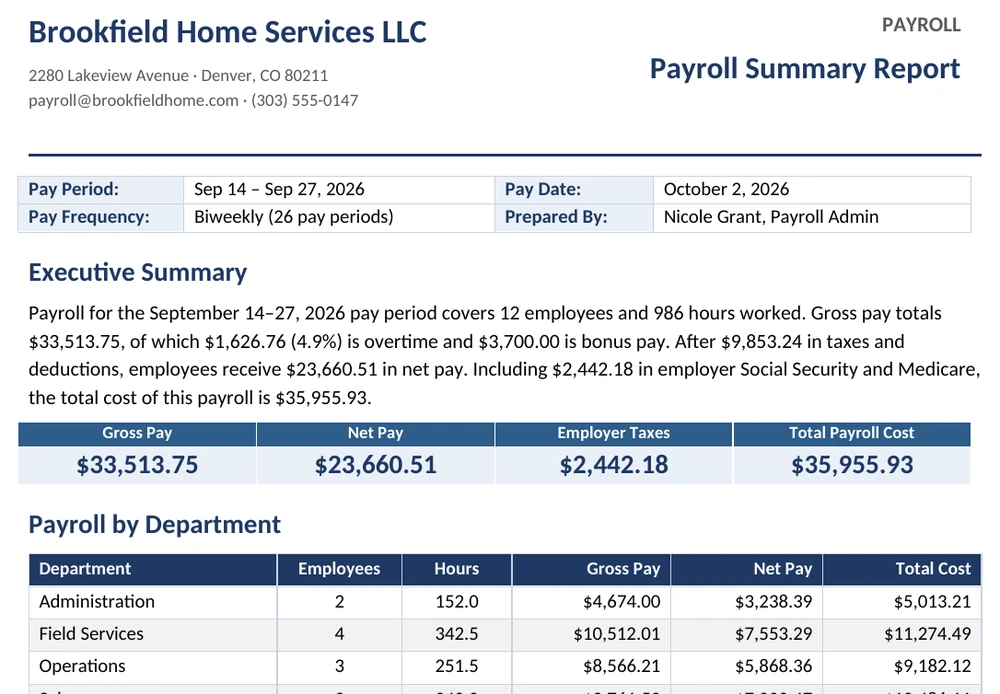
This document is the reporting layer. It opens with a company header, pay period, pay date, pay frequency and preparer, then gives a short executive summary and four headline figures: gross pay, net pay, employer taxes and total payroll cost. A department table shows headcount, hours, gross pay, net pay and total cost for each team.
An earnings and deductions table walks from regular, overtime and bonus pay down to net pay, with each item as a percentage of gross. The second page lists every tax and deduction liability with the employee share, employer share, total to remit and due date, followed by notes that explain unusual items and an approval table for the preparer, reviewer and approver.
Best for: payroll administrators, controllers and accountants who need to present each payroll run to owners, managers or clients for review and approval.
What to Include
Whatever tool you use, a complete payroll report contains the following sections. The first group comes from timesheets and employee records; the rest is calculated.
| Section | What It Shows | Why It Matters |
|---|---|---|
| Report header | Company name, pay period dates and pay date | Ties every figure to one specific payroll run |
| Employee details | Name, employee ID or department, pay type | Lets you total and review pay by team or cost center |
| Pay rate | Hourly rate or annual salary | The basis for every earnings calculation |
| Hours worked | Regular hours and overtime hours | Drives hourly pay and flags excessive overtime |
| Gross pay | Regular pay plus overtime, bonuses and commissions | The starting point for taxes, deductions and expense |
| Pre-tax deductions | 401(k), health insurance and other benefit deductions | Reduce taxable wages and must be sent to providers |
| Employee taxes | Federal and state income tax, Social Security, Medicare | Amounts withheld that you must deposit on time |
| Net pay | Gross pay minus all deductions | The amount actually paid to each employee |
| Employer taxes | Employer Social Security and Medicare (and FUTA/SUTA) | Part of the true cost of payroll |
| Totals and summaries | Totals by department and by liability | Support cash planning, journal entries and filings |
| Notes and approval | Explanations, reviewer and approver sign-off | Creates an audit trail for every payroll run |
How to Create a Payroll Report (Step by Step)
- Set up the pay period. Enter the pay period start and end dates, the pay date and the number of pay periods per year (26 for biweekly, 24 for semi-monthly, 52 for weekly, 12 for monthly).
- Confirm your tax rates. Check the Social Security and Medicare rates, your state income tax rate and the overtime multiplier in the settings cells.
- Collect approved timesheets. Gather regular and overtime hours for hourly employees, plus any bonuses, commissions or other pay for the period.
- Enter employee details. Add each employee’s department, pay type, rate, hours, bonus, 401(k) percentage, health insurance premium and federal withholding rate in columns A to J.
- Let the formulas calculate pay. The template works out regular pay, overtime pay, gross pay, each deduction and net pay. Scan the overtime column, which is highlighted when hours are entered.
- Review the totals. Check that gross pay minus total deductions equals net pay and that the Payroll Summary check shows Balanced.
- Schedule the remittances. Use the liability table to plan federal tax deposits, state withholding payments, 401(k) transfers and insurance premiums.
- Prepare the summary report. Copy the headline totals, department figures and liabilities into the Word template, add notes on unusual items and send it for approval.
- File and compare. Save a copy of every payroll run. Comparing periods shows trends in overtime, headcount and labor cost.
Formulas and Example
The Excel template keeps its logic simple so you can audit every number. Settings sit in the yellow cells (periods per year in E4, overtime multiplier in H3, state tax rate in H4, Social Security in J3 and Medicare in J4) and the first employee is in row 7. Each formula is copied down the table.
| Column | Formula (row 7) | What It Does |
|---|---|---|
| Regular Pay | =ROUND(IF(C7="Salary",D7/$E$4,D7*E7),2) | Salary ÷ periods per year, or hourly rate × regular hours |
| Overtime Pay | =IF(C7="Hourly",ROUND(D7*F7*$H$3,2),0) | Hourly rate × overtime hours × 1.5 (salaried staff get 0) |
| Gross Pay | =K7+L7+G7 | Regular pay plus overtime plus bonus |
| 401(k) | =ROUND(M7*H7,2) | Gross pay × the employee’s contribution percentage |
| Federal Tax | =ROUND(MAX(0,M7-N7-I7)*J7,2) | Taxable wages (after 401(k) and health) × withholding rate |
| Social Security | =ROUND(MAX(0,M7-I7)*$J$3,2) | FICA wages (after pre-tax health) × 6.2% |
| Medicare | =ROUND(MAX(0,M7-I7)*$J$4,2) | FICA wages × 1.45% |
| Net Pay | =M7-S7 | Gross pay minus total deductions |
| Department total | =SUMIFS('Payroll Register'!$M$7:$M$18,'Payroll Register'!$B$7:$B$18,$A7) | Adds gross pay for the department named in A7 of the summary |
Example: Linda Okafor is an hourly employee in Field Services paid $31.00 an hour. She worked 80 regular hours and 9 overtime hours. Regular pay is 80 × $31.00 = $2,480.00 and overtime pay is 9 × $31.00 × 1.5 = $418.50, so gross pay is $2,898.50. Her 5% 401(k) contribution is $144.93 and her health premium is $210.00. Social Security is ($2,898.50 − $210.00) × 6.2% = $166.69 and Medicare is $38.98. Federal tax at 10% of $2,543.57 taxable wages is $254.36 and state tax at 4% is $101.74. Total deductions are $916.70, leaving net pay of $1,981.80.
Across all 12 sample employees, gross pay is $33,513.75: $28,186.99 regular pay (84.1%), $1,626.76 overtime (4.9%) and $3,700.00 bonuses (11.0%). Deductions total $9,853.24, or 29.4% of gross, so net pay is $23,660.51. Adding $2,442.18 of employer Social Security and Medicare brings the total payroll cost to $35,955.93, and the business must remit $12,295.42 in taxes and benefit deductions.
Note: the template uses a simple effective federal withholding rate per employee so the math is easy to follow. For real payroll, take federal withholding from IRS Publication 15-T or your payroll software, and remember that Social Security stops at the annual wage base and that FUTA, SUTA and local taxes may also apply.
Tips
- Lock the cutoff dates. Pick a fixed timesheet cutoff for each pay period so late hours are always handled the same way in the next run.
- Review overtime every run. Overtime that keeps appearing for the same team usually points to understaffing or scheduling issues, not a one-off rush.
- Separate pre-tax and post-tax deductions. Health insurance under a Section 125 plan reduces both income tax and FICA wages, while traditional 401(k) contributions reduce only income tax wages. Mixing them up changes every tax figure.
- Reconcile to the bank. Net pay on the report should match the direct deposit file and the bank debit to the cent.
- Keep a payroll calendar. List pay dates, tax deposit dates, quarterly filing dates and benefit remittance dates in one place so nothing is paid late.
- Protect the file. Payroll reports contain sensitive pay information. Store them in a restricted folder and share the summary report rather than the full register when possible.
- Insert rows inside the table. Add new employees above the TOTAL row so every total and summary formula expands to include them.
Payroll Report vs Payroll Register vs Pay Stub
These three documents are related but serve different readers. The table below shows how they compare.
| Feature | Payroll Report | Payroll Register | Pay Stub |
|---|---|---|---|
| Who it is for | Owners, managers, accountants | Payroll and accounting staff | The individual employee |
| Level of detail | Totals by department and liability | Every employee, every earning and deduction | One employee’s pay for one period |
| Main purpose | Review, approve and plan cash | Calculate and record payroll | Explain an employee’s pay |
| Shows employer taxes | Yes | Often | Usually not |
| Typical use | Management reporting, journal entries | Audit trail, tax filings, reconciliations | Employee records, proof of income |
| In these templates | Word payroll summary report | Excel Payroll Register sheet | Not included |
Related Report Templates
Payroll connects to the rest of your financial reporting. These free templates help you cover the other pieces:
- Attendance Report Template – track hours, absences and leave that feed into each payroll run.
- Accounts Receivable Aging Report Template – make sure customer collections keep pace with payroll and other cash needs.
- Cash Flow Statement Template – see how payroll and tax payments affect your cash balance.
- Profit and Loss Statement Template – report wages and payroll taxes alongside revenue and other expenses.
- Budget Report Template – compare actual payroll cost with the labor budget and explain variances.
- Expense Report Template – handle employee expense reimbursements separately from wages.
Frequently Asked Questions
What is the difference between gross pay and net pay?
Gross pay is the total an employee earns before anything is taken out, including regular pay, overtime, bonuses and commissions. Net pay, often called take-home pay, is what is left after income taxes, Social Security, Medicare and benefit deductions such as 401(k) and health insurance. In the sample payroll, net pay is 70.6% of gross pay.
How often should I run a payroll report?
Run a payroll report for every pay period, before payday, so the figures can be reviewed and approved. Many businesses also prepare monthly, quarterly and year-to-date payroll summaries to support journal entries, Form 941 filings and year-end W-2 preparation.
What is the total cost of payroll for an employer?
The true cost of payroll is gross pay plus the employer’s share of payroll taxes and any employer-paid benefits. At minimum, employers match Social Security (6.2%) and Medicare (1.45%), and most also pay federal and state unemployment taxes. The Excel template adds employer FICA to gross pay to show total payroll cost, and you can extend it with columns for unemployment tax or employer benefit contributions.
Can I use this template to calculate federal withholding?
The template uses a simplified effective withholding rate for each employee so you can see how the numbers flow. Actual federal withholding depends on each employee’s Form W-4, pay frequency and the IRS tables in Publication 15-T. Calculate the real amount with those tables or your payroll software and enter it in place of the rate-based figure.
Can I use these templates in Google Sheets or Google Docs?
Yes. Upload the .xlsx file to Google Drive and open it with Google Sheets; the IF, ROUND, SUMIFS and COUNTIF formulas work as they do in Excel, though some formatting such as data bars may look different. The .docx report opens in Google Docs, Word and LibreOffice Writer.

